Historically, March and April are the biggest selling months of the year in real estate. So here we are about a week away from the start of the spring market. In Richmond, the market is strong and it is becoming more of a seller's market because of low inventory in some areas. I have decided to start featuring some real estate sales statistics on my blog. I will try not to bore you! First up is Area 22 in Henrico!
 |
| Richmond, VA Real Estate Zone Map |
See below data from January 2009 to January 2014 highlighting the close price to list price ratio in Area 22 - Henrico. In particular, look at the near 100% ratios from June and July of 2013. I was in a few bidding wars last year, inventory is low and homes that are priced and staged appropriately are in many cases getting multiple offers therefore driving up the close to list ratio.
There are some areas in Henrico with much higher price per square foot ratios. This slide illustrates the fall from 2009 highs to back to nearly the same price per square foot in the start of 2014. Also, look at the jump from January 2013 to January of this year.
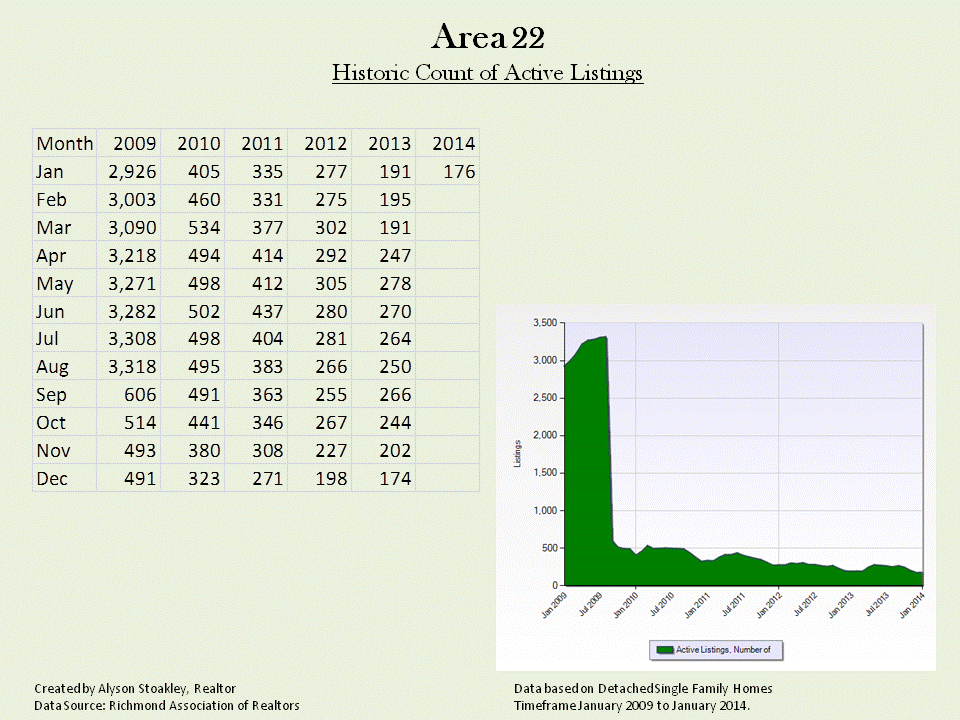
This slide further illustrates the low inventory. Hopefully we will continue to see more and more listings come on the market in the next few weeks. If you are thinking of selling your home, now is the time to get it ready.
Call me if I can be of any assistance with your Richmond, VA home buying and selling needs. Also, contact me if you would like me to pull specific data for your neighborhood. Click here to view my real estate website with further information on my listings and sales. Next up, area 64 in Chesterfield County. Stay tuned and have a great weekend.


No comments:
Post a Comment
Note: Only a member of this blog may post a comment.